Invest in forex – reading charts
19-05-2025
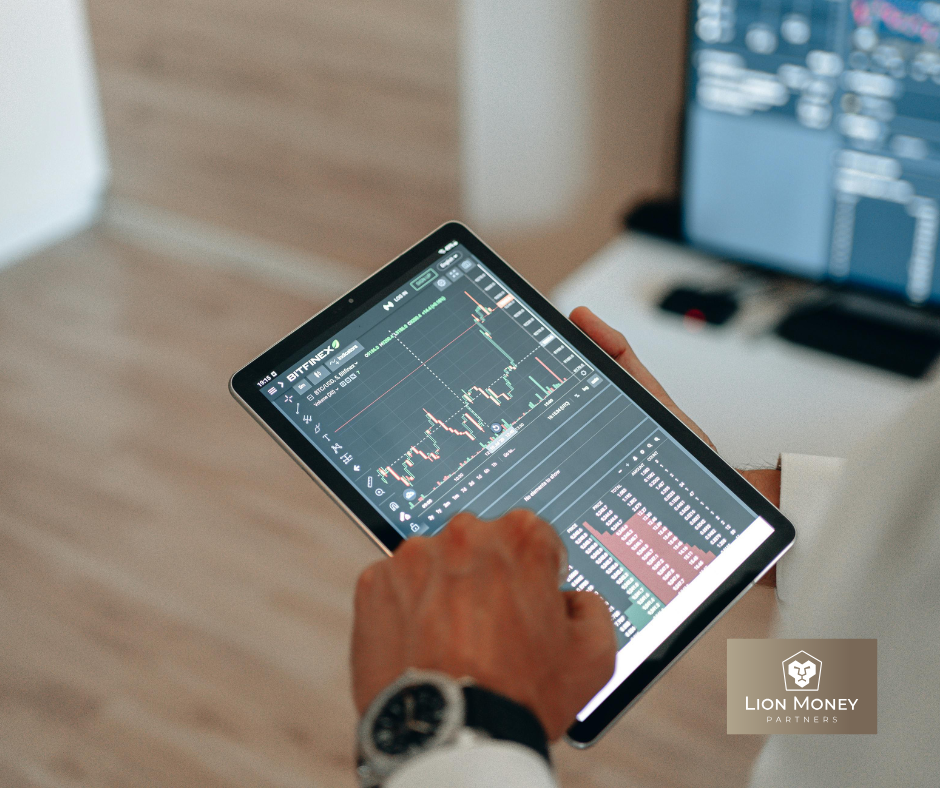
Initial diagnosis
When starting your adventure with the forex market, the ability to read charts becomes a key element. They are the basic analysis tool that allows investors to make informed decisions. Initial diagnosis involves not only learning how to interpret visual data, but also understanding the mechanisms that govern it. Preparation for this role requires commitment and regularity in acquiring knowledge. Using resources such as the Lion Money Partners educational portal can prove to be invaluable support at the beginning of the investment journey. It is a valuable practice to participate in a variety of investment training courses that offer a comprehensive view of the technical and fundamental analysis of the forex market. Thanks to them, you can gain not only the theoretical foundations, but also the practical skills needed to operate effectively on the investment market. For those who prefer more interactive forms of learning, there are also investment presentations that allow you to absorb knowledge in an accessible way. Reviews of Lion Money Partners indicate the high quality of materials and the professionalism of the hosts. Regular use of such resources is a step towards a better understanding of market mechanisms and building solid foundations for future investment success.
Line Chart ...
One of the simplest tools for technical analysis, the line chart is a foundation for any beginner forex trader. Its design is based on connecting successive price points with a line, which allows you to visualize changes in the value of an asset over time. These types of charts are especially useful for identifying trends and patterns that may indicate future price movements. A key feature of a line chart is its clarity and ease of interpretation. Thanks to this, even people taking their first steps in the world of investing can quickly understand the basic mechanisms governing the market. When analyzing a line chart, you should pay attention to several important aspects:
- Trend following – The line connecting the price points allows you to see the direction in which the market is moving.
- Determining support and resistance levels – These key levels help predict moments of potential trend reversals.
- Pattern identification – although less detailed than other chart types, it still allows you to spot basic patterns.
- Time perspective – choosing the right time interval can significantly affect the quality of the analysis.
When using a line chart, it is recommended to include additional analytical tools for a more complete picture of the market situation. It also does not hurt to regularly update knowledge about current economic events affecting exchange rates. In this way, you can make investment decisions more effectively and minimize the risks associated with the unpredictability of the forex market.
Bar Chart ...
A bar chart is one of the fundamental analytical tools on the forex market. Its structure is based on simplicity and transparency, making it an ideal choice for novice investors. Each bar illustrates the price range over a specific time frame, presenting key information such as the open, close, and high and low values over a given period. This allows you to get a complete picture of the market dynamics. When interpreting bar charts, there are several important aspects to consider:
- post height,
- the location of the opening and closing price,
- length of shadows.
Bar chart analysis also requires taking into account the market context and other technical indicators. These values can help identify potential turning points or confirm existing trends. It also doesn't hurt to use additional technical analysis tools that can help you better understand the market situation. It is recommended that you regularly practice your bar chart reading skills by analyzing historical market data. This practice allows you to develop your investment intuition and build confidence when making trading decisions. As you gain experience, you can notice subtle signals coming from the charts that may have previously escaped the attention of a novice investor.
Candlestick chart ...
The candlestick chart, the so-called Japanese chart, has been the foundation of technical analysis in the forex market for years. Its characteristic candlesticks, made of bodies and shadows, reveal not only the price movements of a given period, but also the emotions of investors. Understanding the structure of this chart allows you to identify market patterns and trends. Beginner traders should pay close attention to candlestick patterns, such as the hammer or the morning star, which can signal potential changes in the direction of the market. The opening and closing values as well as the session highs and lows are key elements of any candle, the analysis of which can contribute to making more informed investment decisions. For those who are just starting their adventure with investing in the forex market, the Lion Money Partners training portal offers a wide range of educational materials. Investment training from Lion Money Partners covers not only the basics of technical analysis, but also advanced strategies for using the candlestick chart in everyday trading. Lion Money Partners is a perfect place for every beginner trader who wants to explore the secrets of the financial market under the supervision of experienced specialists. Be sure to take advantage of the educational resources available to you and develop your analytical skills in order to succeed in the world of investing. Investing in the forex market requires the ability to read charts, which is a crucial part of successful trading. Starting with the initial recognition, it is important to understand the differences between the basic types of charts – line, bar, and candlestick. Each offers unique insights into price movements and aids in investment decisions. It is worth exploring these tools and developing your analytical skills to be able to better predict market changes. Awareness of these mechanisms allows not only for development as an investor, but also for more conscious capital management in the dynamic world of finance.